


EDR (Endpoint Detection and Response) is part of a security toolset to ensure protection of computers (endpoints) in a network. EDR is complimented with AV, IDS/IPS and SIEMs.
What makes EDR great, is the reported insight of every known endpoint on the network. From application crashes, registry modifications, to threat actions, EDR gives insight on each endpoint through the installed agents that report back to the server. Alerts are triggered under rule thresholds, and notifications broadcast (if configured).
Wazuh
Wazuh is an open source EDR and SIEM, which I first was introduced to through Security Onion (SOC in a box). I recently started using Wazuh outside of Security Onion for a personal project.
Utilizing the ELK stack, Wazuh publishes results of aggregated data from installed agents into nice graphs and visualizations (in the SIEM). In the screenshots below, I show case Wazuh being used in a lab environment (set up using a Docker single-node of Wuzah) and what data it can process — but much of the power of Wazuh goes beyond this simple demonstration as Wazuh can validate PCI DSS, GDPR, NIST and other compliance based rulesets.
Homepage
After logging into Wazuh, the homepage loads with a set of modules, grouped by category:
In the screenshot above, the agent count is listed (in this case 2 agents: one desktop and one laptop), and both agents are active. Further down the page are the modules grouped by category. Below are some examples of a few modules.
Agents
Each agent can be pulled up for relevant information and reporting. Above, the screenshot shows a brief summary of the two Wazuh agents running.
More detailed data can be provided on the agents through the respective line items on this screen:
Digging further, under recent events, each of the registry modifications listed can be expanded to detail the exact changes (previous values, new values, etc.)
Security Events
The Security Events module above, is showing the top half of the dashboard. If you’re familiar with the ELK stack, it will look familiar as Wazuh uses ELK under the hood. There’s the familiar query search field and time frame dropdown. The first two graphs detail alert levels and MITRE ATT&CK rules.
The alert level modal details the alerts by level and quickly showcases a high level event and/or spikes in a type of event. Events can of course be filtered in or out.
If a specific agent is being interrogated the reporting dashboard will display differently, with more details:
Towards the bottom of the view is an event table. Filtering any component, asset, alert type, will filter all data on the display — including the alerts in the table.
Each row in the table can be expanded to show details of what occurred. The level column will sort by level ascending or descending.
Integrity Module
The integrity module (in the Security Info group) can detail events on specific endpoints that relate to system inventory and events related to integrity.
Above is the default load of the dashboard, however, at the top left are two other options: Inventory and Events. Inventory will disclose files on an endpoint that have been changed or modified and on what dates. This may include hosts file entries, drivers and more. Under Events, there is a table of output showing recent events on the endpoint. This view can be modified by add in rules listed in the left-side panel:
MITRE ATT&CK
MITRE ATT&CK is a categorization of cyber attack vectors. It’s very useful and can be found online at https://attack.mitre.org/
Wazuh has a view utilizing MITRE ATT&CK tactics as rules to identify potential threats on an endpoint (computer).
The above graph is an example of a SIEM view of this MITRE ATT&CK based rules applied to a specific endpoint. The only thing missing here is an event table… isolating a detection, it would be nice to see the result of the details of said event.
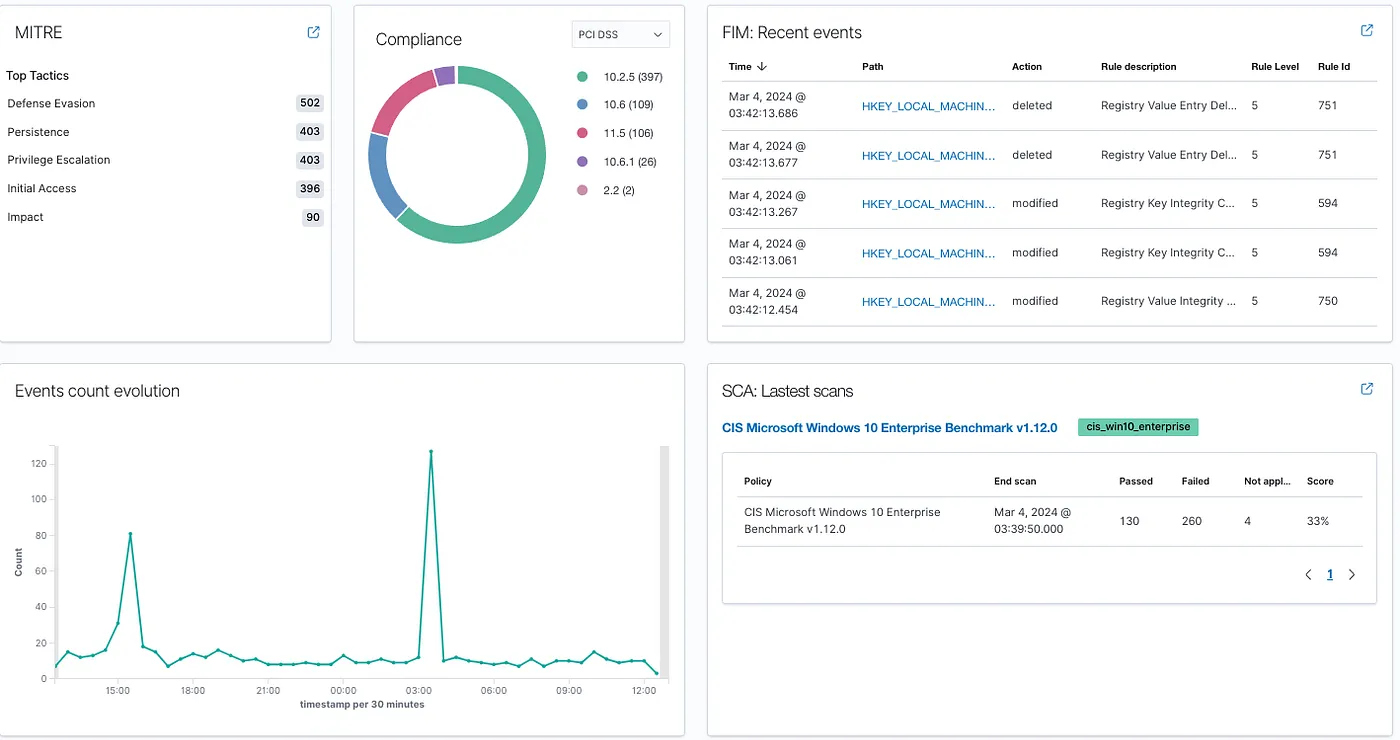
Compliance Dashboards
The demo used for these screenshots was on a local home-based lab, and as such is used to demonstrate the data acquisition. Several screenshots were acquired to showcase the reporting of compliance:
PCI DSS
Above is the default load of the dashboard, however in the upper right there are two other options: Controls and Events.
Controls loads out the PCI DSS rules that are applied against the data stream from an agent. Below is an example:
NIST 800–53
Like the previous dashboards, this one also has views for Controls and Events. Above is the default view, which identifies breaks in requirements to NIST compliance. In this lab example, there is a spike in the early morning for requirements 164.312.c.1 as well as 164.312.c.2.
Checking the events tab, and filtering on the spike (clicking on it), the data is displayed in the table identifying this as a Windows Login at 3AM from a SYSTEM process.
Further into the details the rule is explained in full:
Other compliance screens are:
- TSC
- GDPR
- HIPAA
Notifications and Reporting
Notifications can be configured through the Left Menu / Open Search Plugins / Notifications. Available notifications as of this writing are:
- Slack
- Chime
- Custom Webhook
- Amazon SNS
As for reporting, any screen (dashboard, events, etc.) can be output as a PDF report. The report writer is very good and the output is very clean. Effective, and to-the-point reports are generated as PDF.
Installing Wazuh
The Wazuh EDR has three components. These can be installed in a standalone vertical structure, or across three different machines. For simplicity I’m only going to discuss using a single node installation. Wazuh provides installation scripts (to make this easier) and if run in a non-Ubuntu environment, you’ll get an error that the script doesn’t support your Operating System (even if it’s Debian based). There are flags (-i) to override this, but if you force the install, it will just have problems down the line. There is a way to do this, but I’ll start with the easiest method (Ubuntu).
Ubuntu Requirements
The machine, or VM, will need at least 8GB of memory. It really depends on what you’re doing with that box. If it just runs Wazuh, 6GB might be sufficient for a slim, non-GUI linux install.
Wazuh itself requires 4GB of memory to run.
Wazuh install on Ubuntu
I used the latest version of Ubuntu (22.*), and installed it on a low end machine I had laying around.
Once Ubuntu comes up, all you really need to do is read the documentation and execute each script in order:
- Indexer
- Server
- Dashboard
If you are familiar with ELK, these correspond to the three components in the ELK stack (Ealstic, Logstash and Kibana).
Assuming we’re doing a simple, single-node (meaning Wazuh’s components are all installed on one machine/vm) setup, we’ll install the indexer first, following the instructions. What I do first is create a “wazuh” folder on the Ubuntu box. Then cd into it and run the curl commands to grab the config files it mentions in the linked documentation.
Once you run the curl commands, you’ll have a config file that the documentation asks you to modify with your own values for the IP. Make note of the names defined in the config file: node-1, wazuh-1 and dashboard. These can be changed, but whatever values you’re using, jot it down. You’ll likely want to define the IP address as a static reference to this machine’s IP. Make sure the IP doesn’t change. Yes, it does support 0.0.0.0 (for dynamic IP addressing) but your agents (installed on each endpoint in the network) will need updating if the IP changes on the Wazuh server. Make sense? So set up the server as a static IP.
Follow the instructions for running the shell script and verify the installation as described in the documentation.
After the Indexer, you start the assisted script for the server. Follow the documentation for the assisted server install. It will make use of files you’ve created/configured prior, so make sure you aren’t deleting anything as you go along.
After the server is setup, you move on to the final install using the assisted script, as described in the documentation.
Once the dashboard is setup, pulling up the IP of the Wazuh server should bring up the user interface. To login, you’ll need to know the password that was generated during installation. This is discussed at the end of the Dashboard configuration:
tar -O -xvf wazuh-install-files.tar wazuh-install-files/wazuh-passwords.txt
Restarting the Machine — Restart the Dashboard
One thing I’ve noticed is that if you restart the Wazuh box where the Dashboard is installed (on a single node install it’s the same box), you’ll likely need to restart the dashboard service:
systemctl restart wazuh-dashboard
You can always validate if it needs restarting by running
systemctl status wazuh-dashboard
Installing Wazuh on a Non-Ubuntu Debian Linux
What if you want to install Wazuh on Linux Mint, Kali Linux, ParrotOS or another Debian Linux flavor? It can be done, but it requires a more effort. If you want the easiest solution, setup an Ubuntu VM.
On my Kali Purple installation I went through these steps below — NOTE: If at anytime you screw up, run the install script to remove all the Wazuh modifications and start over.
Instead of the assisted script, we need to follow the step-by-step installation documentation.
Yes, it’s more complex, but really it’s just following instructions.
For a single node install, make sure you don’t delete the tar file. The tar file is used in each of the Wazuh installations.
After installing the Indexer, move on to the step-by-step setup for the server, by following the documentation. Note, you don’t have to update each time. Also — this part (server install) goes into the Filebeat installation and configuration.
Filebeat Gotcha
Wazuh is only compatible with Filebeat 7.10.2. When I installed Filebeat as described, it defaulted to 7.17.* (latest version) but if you run the install script on Ubuntu you’ll get the right correct version. Installing on a non-Ubuntu, you’ll need to run a variation of the Filebeat install, where we send in the version number:
sudo apt install filebeat=7.10.2
After installing the server, move on to the step-by-step setup for the dashboard, by following the documentation.
Once the dashboard was installed and all services are running, you should be able to go to the IP and login… HOWEVER, you’ll likely reach an issue regarding access levels. It seems that what we did in the step-by-step instructions neglects to mention creating new passwords. If you get an error on the Wazuh login page, that references Access errors, you’ll likely need to regenerate the passwords for Wazuh:
(optional) # bash wazuh-passwords-tool.sh -a
This will generate strong passwords, which will get past the access issue (if you get it).
Installing Containerized Wazuh
Following the documentation under alternative installs, there is the Docker Wazuh Installation documentation. This is fairly straight forward using docker-compose. By default the docker-compose install creates an admin user with a password: SecretPassword, which you can obviously change in the GUI.
The Docker Wazuh installation offers both single node setups, as well as multi-node.
Gotchas
Docker offers a quick and simplistic method of deployment of Wazuh, but configuration to your tailored needs can become more complex. Let me explain: As the Wazuh docker doesn’t come with an email configuration, you have to not only expose the configuration files, but you also need to expose access to your host’s SMTP server — a feat I do not currently know how to do.
Setting Up Email Notifications
You might be tempted to set this up in the GUI — DO NOT DO SO. The GUI administration screens may talk about email notifications, but none of it will work. Even the official Wazuh documentation uses a much different approach.
Read through the documentation linked in the paragraph above — some steps come AFTER they give you a command that won’t work right if you didn’t configure it correctly. For example, on step 3 of the instructions for GMAIL it has us echo a username/password, but under the code it mentions that this password needs to be an API password…
Docker: If you setup Wazuh as a docker container, this gets more complex. The docker container does not have email notification setup at all. Postfix (or any SMTP server) is missing from the Docker. You can externalize the ossec.conf (detailed in the instructions) so it can be read by the OS. You’ll need a way to externalize the SMTP server itself (which I don’t know how to do with Docker).
PostFix Server
Wazuh requires an SMTP server to be configured. Postfix is their preferred SMTP server solution. The documentation walks through setting this up and echo’ing a test email to make sure your OS is sending emails from the command line.
Configuring Wazuh to use Postfix
After that you finish the postfix setup, the documentation walks through the Wazuh config (/var/ossec/etc/ossec.conf) updates. Finally, we restart the wazuh-manager.
Maintenance Issues
I knew a major issue will come up in time: index lifecycle management. All the data that fills the ELK stack (which Wazuh uses under the hood) is established in indices. Each index will get larger and larger. If ELK reaches a disk watermark (I think it defaults to 80% of the hard disk) it will crash and recovery from this state is not a trivial matter.
Index Lifecycle Management
We need to set up index rotation/deletion. Luckily Wazuh has some very simple instructions to accomplish this:
This is managed through the GUI. Logging into the administration part (Left nav / OpenSearch plugins / Index Management / State management policy.
From the State Management Policy screen, we create a new policy.
Following the instructions, you can do this graphically or with JSON. I think JSON is easiest. Simply copy their JSON and paste it into the JSON field. Modify the min_index_age value to a value you want… if you want to retain data for 10 days, change the value to “10d”.
Click create, and then. you need to apply the index management policy to the indexes in question. You don’t need this policy to rotate for all your indexes, just the ones that grow large (the alerts).
Click the left nav option Indices, under the Index Management section.
This page will load with a table of all your indexes. If it’s been running for a few days, you can sort the indexes by size and see which ones are the growing ones. They will tend to be the alerts. Check those larger indices and then when they are checked, click “Actions” and then “Apply policy.”
A dialogue box will popup, and you’ll click a dropdown and select the policy you just created. Now, after every X days, those alert indices will rotate out, so they don’t get too large. You’ll have an alert index for every endpoint you’re monitoring… so if you are monitoring 50 computers, there will be 50 alert indexes that will need a lifecycle policy added in this way.
Conclusion
Having used other open source EDR providers, I really liked Wazuh. Installation comes down to two choices: Ubuntu, or using Docker on your preferred system. While the Docker might appear the easiest approach, it doesn’t come with postfix or any smtp server installed and will likely be more challenging to setup those requirements. My personal choice was to load Ubuntu on a machine, and install against Ubuntu. It was easy and complete in a few minutes.
Wazuh is amazing. I get email notifications when monitored devices have application crashes, or other more serious problems. Policies can be monitored and alerted upon and it helps to quickly isolate problems.